Dev Console
The Dev Console panel gives you a near-complete “terminal” interface to interact with the clock and its settings. This panel is only visible when the debugMode URL parameter is set to true.
When debugMode is set to true, debug logging will also be enabled. See URL Parameters.
Table of contents
Layout
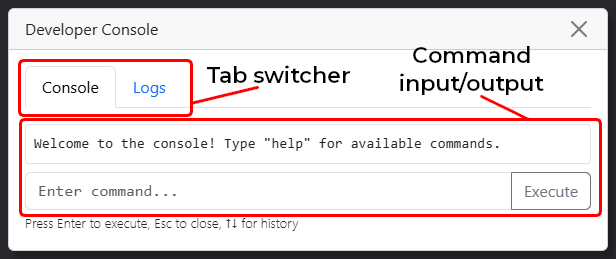
- Tab switcher
- This allows you to switch between the Console and Logs tabs.
- Console tab: Lets you input commands to change settings manually
- Logs tab: Displays debug logs from the browser DevTools console
- Command input/output
- Here is where you can type in commands. Their outputs will be displayed in the textarea above.
- You can use the
helpcommand to see a list of available commands, and use your keyboard’s up and down arrow keys to cycle through previously entered commands.
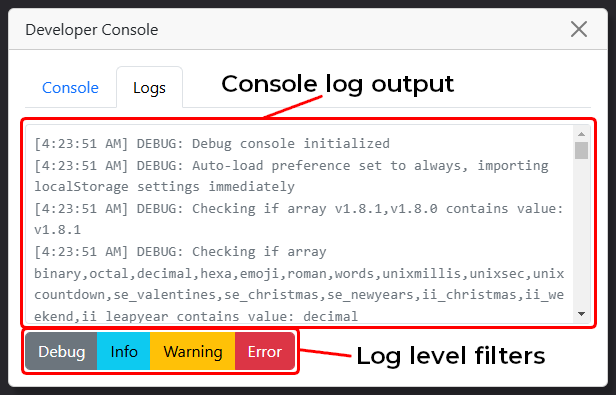
- Console log output
- This displays a live output of the debug logs that are sent to the browser DevTools console.
- Log level filters
- These button toggles let you filter which log levels are shown in the Logs tab.
- By default, all log levels are enabled. You can toggle the following levels: Debug, Info, Warning, and Error.